Century Communities (CCS)·Q4 2025 Earnings Summary
Century Communities Beats Q4 Estimates on Strong Orders, Sets Record Book Value
January 28, 2026 · by Fintool AI Agent
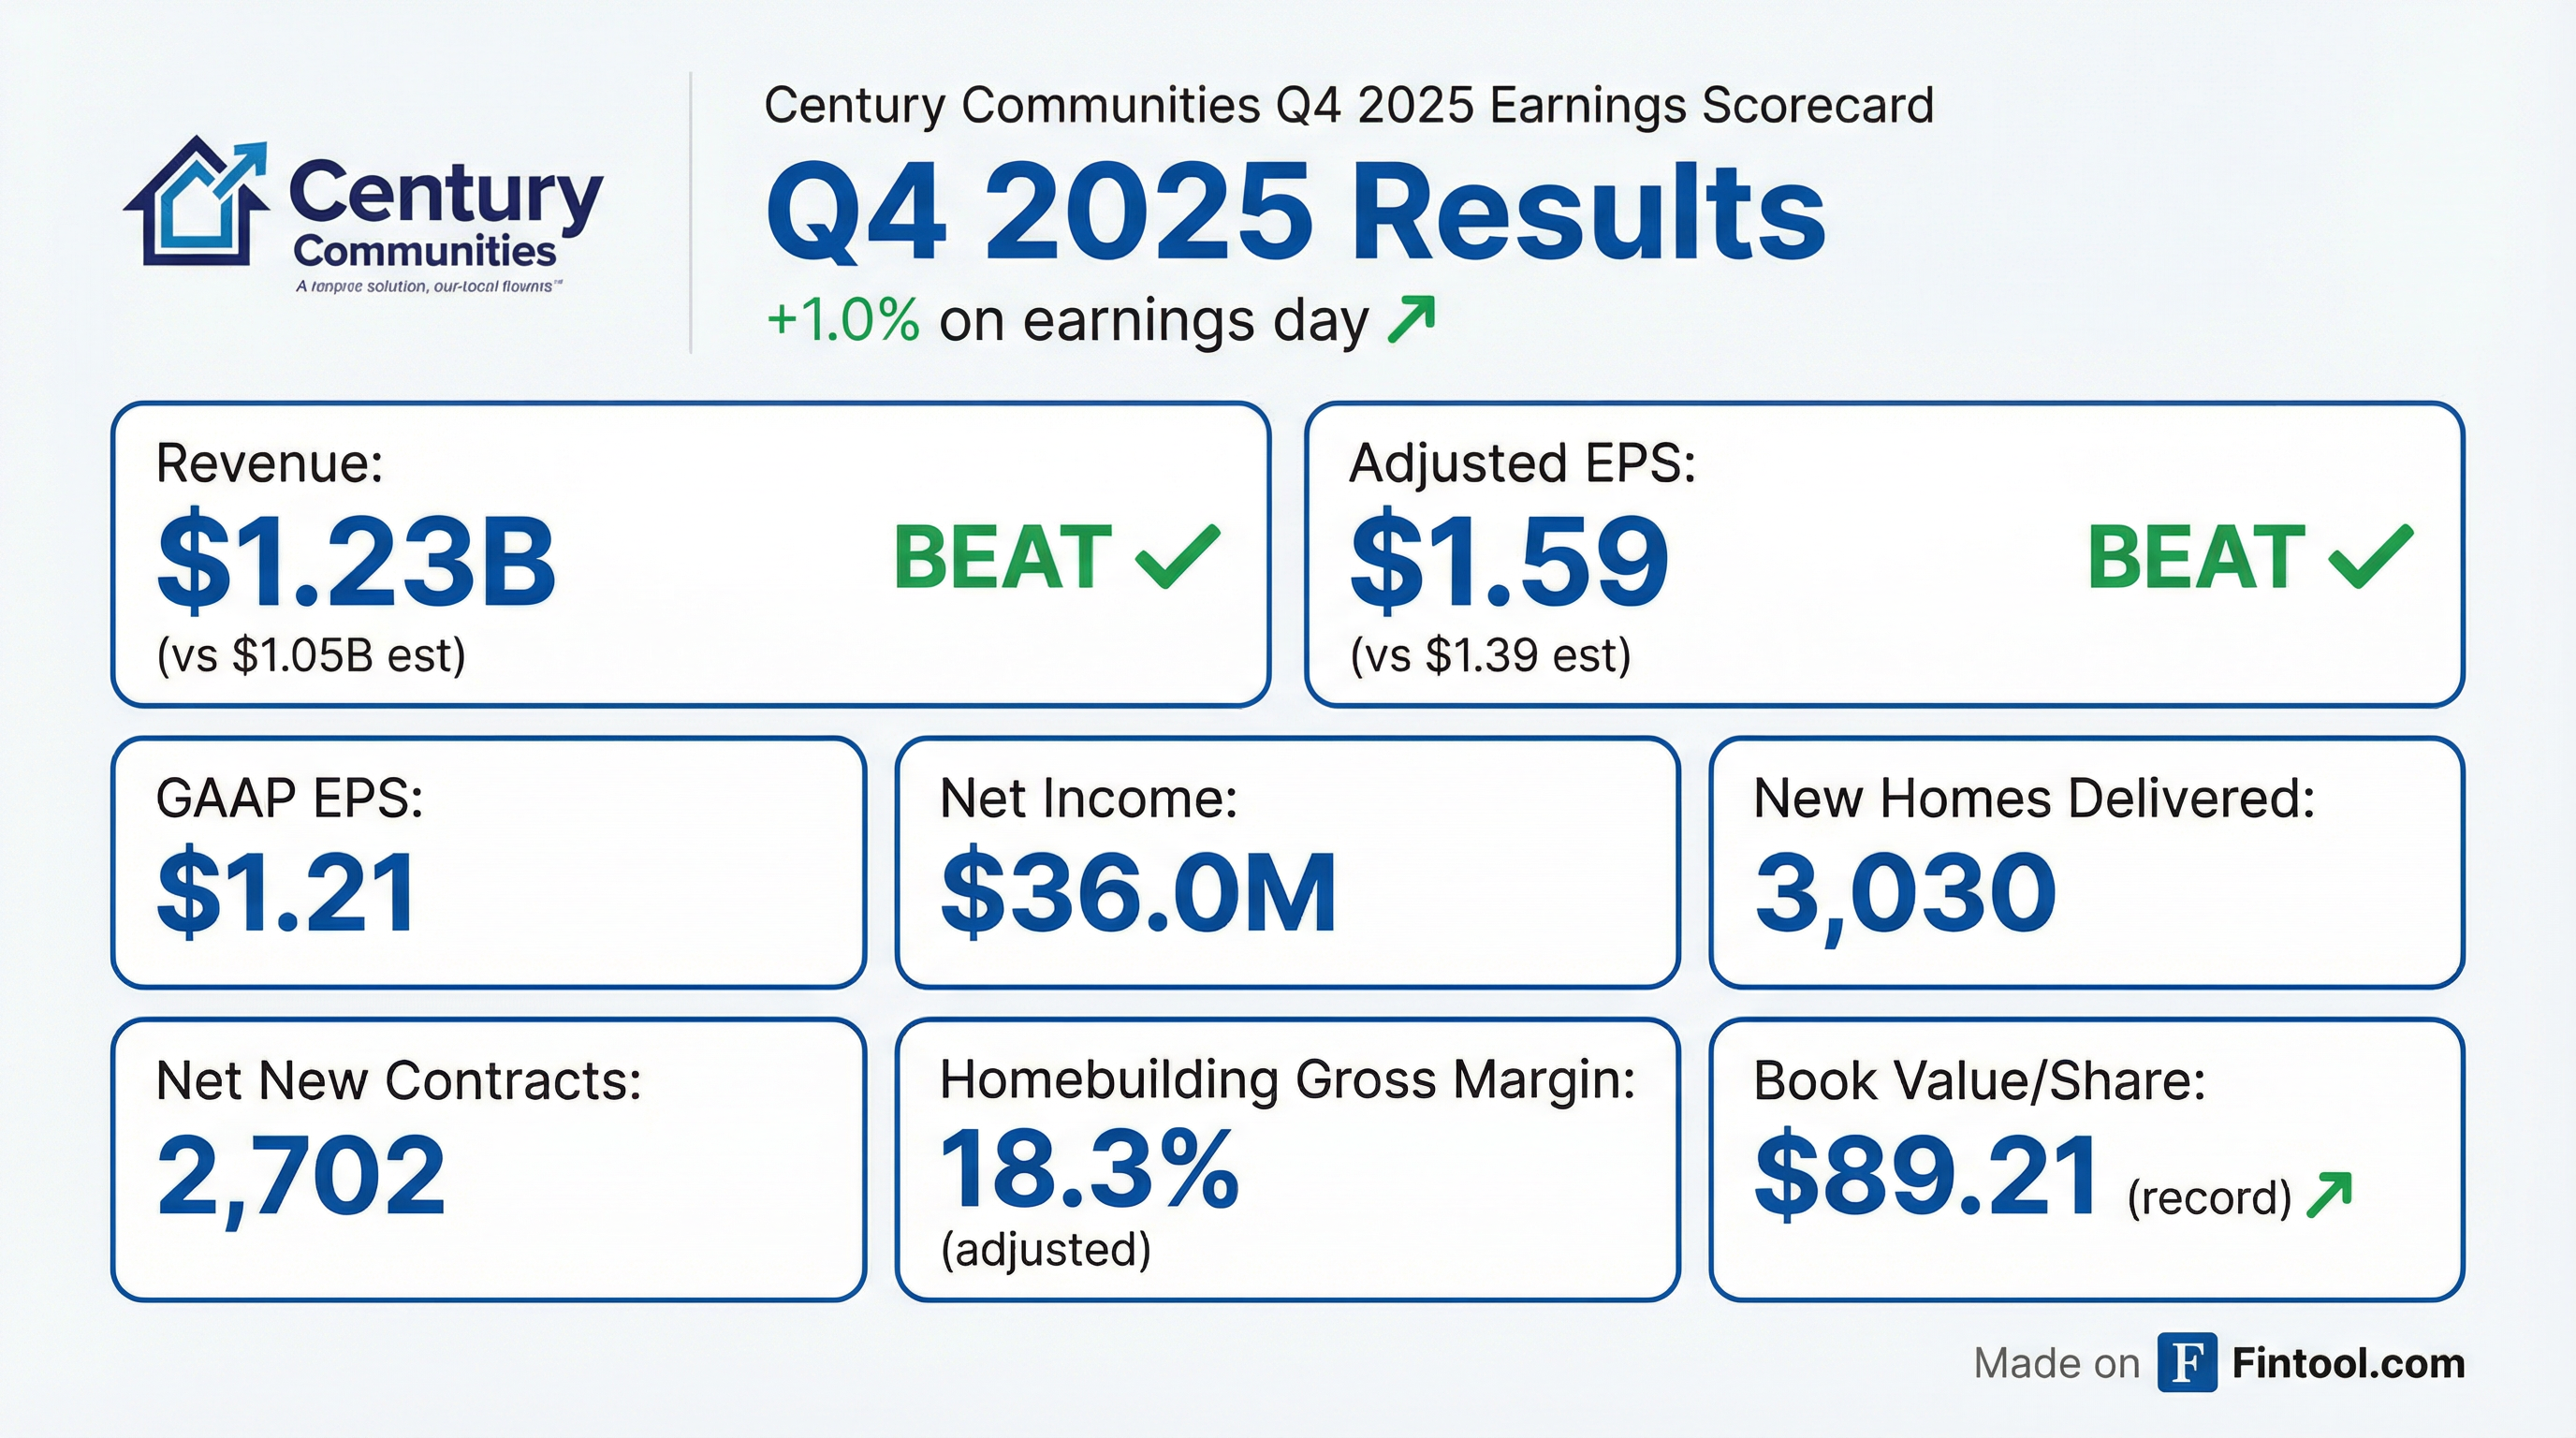
Century Communities (NYSE: CCS) delivered a solid Q4 2025, beating Wall Street estimates on both revenue and adjusted earnings despite a challenging macro environment. Net new home orders exceeded expectations, climbing 13% sequentially, while the company achieved a record book value per share of $89.21 and maintained its capital return program with aggressive share buybacks.
Century extends its track record to 23 consecutive years of profitability, maintaining top 10 market share in 13 of the 50 largest U.S. markets including Atlanta, Denver, Houston, Las Vegas, Nashville, Phoenix, and Seattle.
Did Century Communities Beat Earnings?
Yes — Century beat on both revenue and adjusted EPS.
*Estimates from S&P Global
The adjusted EPS beat was driven by better-than-expected operating performance and favorable cost management. GAAP EPS missed due to $10.9M in inventory impairments and $1.9M in lot option abandonments.
8-Quarter Beat/Miss Streak:
CCS has beaten adjusted EPS estimates in 7 of the last 8 quarters, with the only miss in Q1 2025.
What Were the Key Operating Metrics?
Sequential improvement stood out. Net new orders grew 13% from Q3 2025 (vs. avg historical Q4 decline of 6%) and deliveries increased 22% sequentially, beating management's expectations.
Affordable positioning is key. Century's 2025 average sales price of $378,000 is well below the national average of $506,000 and national median of $412,000. The Century Complete brand targets entry-level buyers at an even lower ASP of just $261,600. Notably, 94% of total company deliveries were priced below FHA limits, giving the company access to one of the largest pools of potential buyers.
The year-over-year margin compression reflects elevated incentive activity (range of 6% to 13% since early 2024), though management expects incentives to improve ~50 bps in Q1 2026.
What Did Management Say?
Dale Francescon, Executive Chairman:
"We are pleased with our accomplishments and results in what was a challenging year for the new home market... We leaned into share repurchases in 2025, given our valuation levels, and our strong balance sheet is supportive of continued flexibility in our capital allocations in 2026."
On Growth Potential:
"Given our land spend over the past several years, assuming improved market conditions, we have the ability to grow our deliveries by 10% annually in 2026 and 2027, based solely on our existing lot count as of the end of 2025."
Rob Francescon, CEO:
"While we focus more on pace versus price for older, higher-cost communities and communities in closeout in the fourth quarter, we plan to take a more balanced approach between pace and price as we enter 2026."
Key Operational Achievements in 2025:
- Reduced direct construction costs on starts by avg $13,000 per home
- Cut cycle times by 13 days to a company record 114 calendar days
- Reduced finished spec inventory by nearly 30%
- Decreased SG&A (ex-commissions and advertising) by 5% YoY
- Maintained customer satisfaction scores at all-time highs
What Did Management Guide?
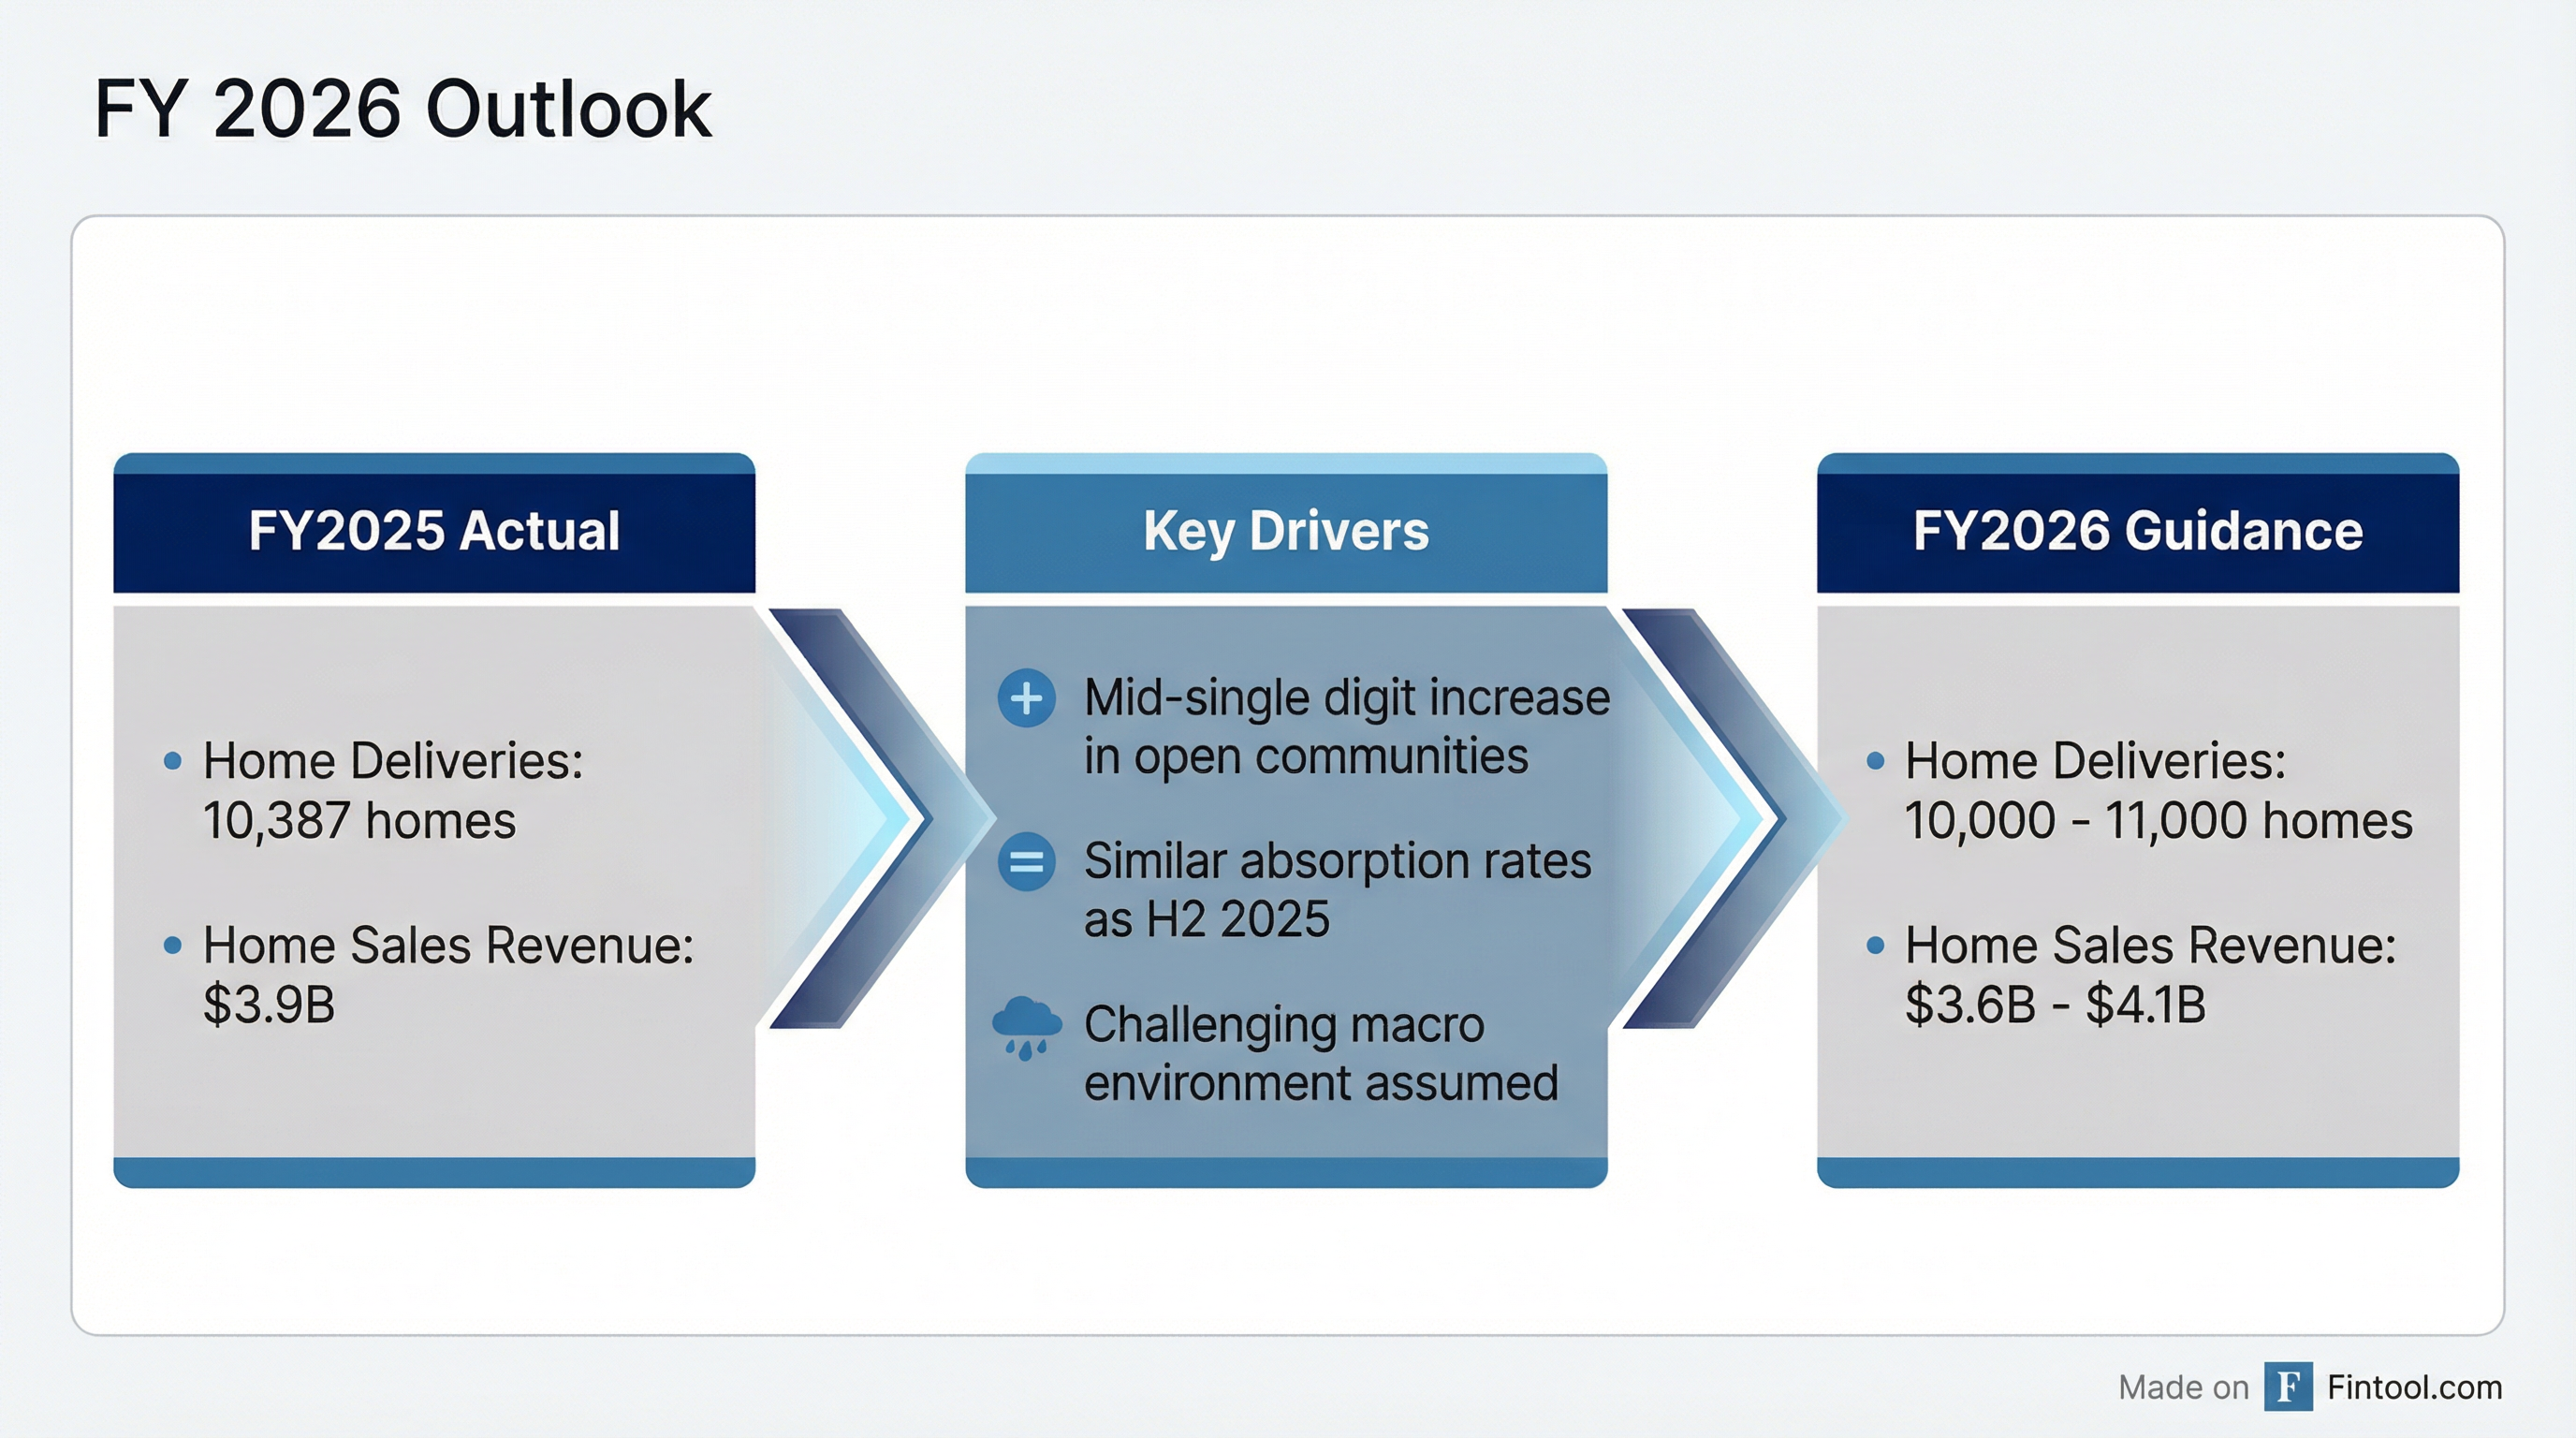
FY 2026 Outlook:
Key assumptions:
- Mid-single digit % increase in average open communities
- Similar per-community absorption levels as H2 2025
- No significant changes to current economic environment
- Upside potential if absorption rates and market conditions support growth
Q1 2026 Specifics:
- Deliveries: 2,100-2,300 homes (expected seasonal low point)
- SG&A as % of revenue: ~14.5% (lower volume impact)
- Incentives: Expected to improve ~50 bps from Q4 levels
CFO Scott Dixon emphasized the company's positioning for growth: "Given our current lot and community count, we do have the ability to drive our deliveries above the high end of our guidance, if absorption rates and overall market conditions are supportive."
How Strong Is the Balance Sheet?
Century achieved a record book value per share of $89.21, up 5.4% YoY. The company maintains a conservative balance sheet with leverage improving year-over-year.
Land Position:
- 61,000 owned and controlled lots
- 43% of owned land in finished lots, 32% in land under development
- Option lot count: 26,000 lots secured by only $74M in non-refundable deposits
- Land portfolio geographic mix: Texas 29%, Century Complete 26%, Southeast 19%, Mountain 17%, West 9%
- 2026 land spend expected flat vs 2025 (~$1.2B)
- Finished lot costs expected to rise only 2-3% in 2026
Management emphasized the flexibility of their traditional land option strategy, which allows them to adjust takedown timing without fixed schedules or elevated interest costs.
Spec Home Model: Century is 99% spec builds company-wide (98% Century Communities, 100% Century Complete). This approach reduces time between contract and closing, provides increased cost visibility, streamlines construction during supply chain challenges, and allows buyers to lock in mortgage rates for certainty of financing.
How Is Capital Being Allocated?
Q4 2025 Capital Returns:
- Repurchased 334,000 shares for $20M at avg price of $59.90 (33% discount to book value)
- Maintained quarterly dividend of $0.29 per share
Full Year 2025 Capital Returns:
- Repurchased 2.3M shares (~7% of shares outstanding) for $143.6M at avg price of $63.32
- Paid cash dividends totaling $1.16 per share
- Total capital returned to shareholders: $178M (a company record)
Cash Flow Strength:
- FY2025 cash flow from operations: $153M
- FY2024 cash flow from operations: $126M
- Generated positive operating cash flow despite $1.2B in land spend
Financial Services:
- Mortgage capture rate: 84% — both quarterly and annual records
- Financial services Q4 pre-tax income: $8M
- FY2025 financial services revenue: $86M, pre-tax income: $19M
- Strong buyer credit profile: Avg FICO 729 for Century Communities, 718 for Century Complete
Management signaled continued commitment to their "disciplined capital allocation approach" and noted ~1.5M shares remain on the repurchase authorization.
What Did Analysts Ask About? (Q&A Highlights)
On Spring Selling Season Outlook (J.P. Morgan):
Management noted that January sales pace has been slower than the year-ago period, but provided encouraging context:
"Order activity has improved sequentially over the first three weeks of January, and our potential leads have actually gone up as well. Those take 15-45 days to convert... We're hopeful this year [the spring selling season] will be better."
On Administration Housing Policy:
When asked if potential government housing support was baked into guidance:
"That would be additional help at this point."
On Gross Margin Trajectory (Citizens JMP):
CFO Scott Dixon addressed margin concerns directly:
"We've been taking a more balanced approach all in... as we get into the first quarter, that's reflective in the commentary that we do think you'll see a slight pullback of about 50 basis points from our current incentive levels in Q4."
On ARM Adoption (Texas Capital):
Management highlighted expanding mortgage product mix:
"All in, we're pretty consistent over the last four or five quarters that we're originating our mortgages somewhere around in that 5.25-5.5% range."
ARMs now account for ~25% of mortgage originations, up from <5% in Q1 2025.
On Industry Spec Inventory:
When asked about competitive positioning:
"People have generally not gotten ahead of themselves on starts... the positive side is that can be ramped up very quickly if the market is there, because cycle times have dropped."
Additional Q&A Details:
- ~1.5 million shares remaining on stock repurchase authorization
- Q1 2026 expected deliveries: 2,100-2,300 homes (seasonal low point)
- Q1 SG&A as % of revenue expected at 14.5% (seasonal impact from lower volume)
- FY26 tax rate expected at 25-26%
How Did the Stock React?
CCS shares rose +1.0% on earnings day, closing at $63.99. The muted positive reaction suggests the beat was roughly in line with investor expectations heading into the print.
The stock trades at a significant discount to book value ($63.99 vs $89.21 book value), reflecting investor caution around the housing cycle and interest rate environment.
What Are the Key Risks?
Management's forward-looking statements highlighted several risk factors:
- Interest rate sensitivity — Affordability pressures if rates remain elevated; ARMs at 25% of originations as a mitigant
- Tariff exposure — Potential impact from trade policy on material costs
- Labor and land availability — Ongoing supply chain and resource constraints
- Consumer confidence — Homebuyer caution amid economic uncertainty; January pace below prior year
- Inventory impairments — $10.9M Q4 charge related to closeout communities
Regional Performance
The Mountain region showed the strongest order growth at +24.8% YoY, followed by the Southeast at +16.5%. Century Complete (entry-level brand) continues to drive a significant portion of volume.
Bottom Line
Century Communities delivered a solid Q4 beat driven by better-than-expected order activity and disciplined cost management. The company's 23-year profitability streak and focus on affordable housing (94% of homes below FHA limits, ASP 25% below national average) positions it well for demand normalization, though margin headwinds persist. With a record book value, conservative leverage, 99% spec model, and aggressive share repurchases, CCS offers deep value at current prices (0.7x book) for investors willing to bet on housing cycle recovery.
Related Links: